Copied
{"graph": {"acyclic": false, "pipe_collision": false}, "nodes": {"0x24a8bf7ef20": {"type_": "nodes.basic.BasicNodeA", "icon": "c:\\Users\\Public\\cheatlayer\\examples\\Move.png", "name": "Start Node 0", "color": [13, 18, 23, 255], "border_color": [74, 84, 85, 255], "text_color": [255, 255, 255, 180], "disabled": false, "selected": false, "visible": true, "width": 160, "height": 71.2, "pos": [130.0, -213.6], "port_deletion_allowed": false, "subgraph_session": {}, "custom": {"Initial Program": "", "Data": "{\"type\": \"Start Node\", \"x\": 0, \"y\": 0, \"Application\": \"\"}"}}, "0x24a8bf7ff70": {"type_": "nodes.basic.BasicNodeA", "icon": "c:\\Users\\Public\\cheatlayer\\examples\\Move.png", "name": "Bash Commands 1", "color": [13, 18, 23, 255], "border_color": [74, 84, 85, 255], "text_color": [255, 255, 255, 180], "disabled": false, "selected": false, "visible": true, "width": 160, "height": 71.2, "pos": [-130.0, -71.19999999999999], "port_deletion_allowed": false, "subgraph_session": {}, "custom": {"code": " \npip3 install pandas numpy matplotlib openpyxl\n\n\n", "Data": "{\"type\": \"bash\", \"code\": \" \\npip3 install pandas numpy matplotlib openpyxl\\n\\n\\n\"}"}}, "0x24a8bfa42e0": {"type_": "nodes.basic.BasicNodeA", "icon": "c:\\Users\\Public\\cheatlayer\\examples\\Move.png", "name": "Python Code 2", "color": [13, 18, 23, 255], "border_color": [74, 84, 85, 255], "text_color": [255, 255, 255, 180], "disabled": false, "selected": false, "visible": true, "width": 160, "height": 71.2, "pos": [130.0, -71.19999999999999], "port_deletion_allowed": false, "subgraph_session": {}, "custom": {"code": " \nimport pandas as pd\nimport numpy as np\nimport matplotlib.pyplot as plt\nfrom openpyxl import Workbook\n\n# Generate random data\ndata = np.random.rand(100, 5)\ndf = pd.DataFrame(data, columns=['A', 'B', 'C', 'D', 'E'])\n\n# Calculate sum and average in new columns\ndf['Sum'] = df.sum(axis=1)\ndf['Average'] = df.mean(axis=1)\n\n# Draw line graph\nplt.figure(figsize=(10, 6))\nplt.plot(df['Sum'], label='Sum')\nplt.plot(df['Average'], label='Average')\nplt.title('Line Graph of Sum and Average')\nplt.xlabel('Index')\nplt.ylabel('Value')\nplt.legend()\nplt.savefig('line_graph.png')\n\n# Export data to Excel\ndf.to_excel('data.xlsx', index=False)\n\n# Open Excel file\nimport os\nos.startfile('data.xlsx')\n", "Data": "{\"type\": \"python\", \"code\": \" \\nimport pandas as pd\\nimport numpy as np\\nimport matplotlib.pyplot as plt\\nfrom openpyxl import Workbook\\n\\n# Generate random data\\ndata = np.random.rand(100, 5)\\ndf = pd.DataFrame(data, columns=['A', 'B', 'C', 'D', 'E'])\\n\\n# Calculate sum and average in new columns\\ndf['Sum'] = df.sum(axis=1)\\ndf['Average'] = df.mean(axis=1)\\n\\n# Draw line graph\\nplt.figure(figsize=(10, 6))\\nplt.plot(df['Sum'], label='Sum')\\nplt.plot(df['Average'], label='Average')\\nplt.title('Line Graph of Sum and Average')\\nplt.xlabel('Index')\\nplt.ylabel('Value')\\nplt.legend()\\nplt.savefig('line_graph.png')\\n\\n# Export data to Excel\\ndf.to_excel('data.xlsx', index=False)\\n\\n# Open Excel file\\nimport os\\nos.startfile('data.xlsx')\\n\"}"}}, "0x24a8bfa4640": {"type_": "nodes.basic.BasicNodeA", "icon": "c:\\Users\\Public\\cheatlayer\\examples\\Move.png", "name": "Bash Commands 3", "color": [13, 18, 23, 255], "border_color": [74, 84, 85, 255], "text_color": [255, 255, 255, 180], "disabled": false, "selected": false, "visible": true, "width": 160, "height": 71.2, "pos": [-130.0, 71.20000000000002], "port_deletion_allowed": false, "subgraph_session": {}, "custom": {"code": " \npip3 install pandas numpy matplotlib openpyxl\n\n\n", "Data": "{\"type\": \"bash\", \"code\": \" \\npip3 install pandas numpy matplotlib openpyxl\\n\\n\\n\"}"}}, "0x24a8bfa4a60": {"type_": "nodes.basic.BasicNodeA", "icon": "c:\\Users\\Public\\cheatlayer\\examples\\Move.png", "name": "Python Code 4", "color": [13, 18, 23, 255], "border_color": [74, 84, 85, 255], "text_color": [255, 255, 255, 180], "disabled": false, "selected": false, "visible": true, "width": 160, "height": 71.2, "pos": [130.0, 71.20000000000002], "port_deletion_allowed": false, "subgraph_session": {}, "custom": {"code": " \nimport pandas as pd\nimport numpy as np\nimport matplotlib.pyplot as plt\nfrom openpyxl import Workbook\nimport os\n\n# Generate random data\ndata = np.random.rand(100, 5)\ndf = pd.DataFrame(data, columns=['A', 'B', 'C', 'D', 'E'])\n\n# Calculate sum and average in new columns\ndf['Sum'] = df.sum(axis=1)\ndf['Average'] = df.mean(axis=1)\n\n# Draw line graph\nplt.figure(figsize=(10, 6))\nplt.plot(df['Sum'], label='Sum')\nplt.plot(df['Average'], label='Average')\nplt.title('Line Graph of Sum and Average')\nplt.xlabel('Index')\nplt.ylabel('Value')\nplt.legend()\nplt.savefig('line_graph.png')\n\n# Export data to Excel\ntry:\n df.to_excel('data.xlsx', index=False)\nexcept PermissionError:\n print(\"Permission denied: 'data.xlsx'. Please close the file if it is open in another program.\")\n\n# Open Excel file\ntry:\n os.startfile('data.xlsx')\nexcept PermissionError:\n print(\"Permission denied: 'data.xlsx'. Please close the file if it is open in another program.\")\n", "Data": "{\"type\": \"python\", \"code\": \" \\nimport pandas as pd\\nimport numpy as np\\nimport matplotlib.pyplot as plt\\nfrom openpyxl import Workbook\\nimport os\\n\\n# Generate random data\\ndata = np.random.rand(100, 5)\\ndf = pd.DataFrame(data, columns=['A', 'B', 'C', 'D', 'E'])\\n\\n# Calculate sum and average in new columns\\ndf['Sum'] = df.sum(axis=1)\\ndf['Average'] = df.mean(axis=1)\\n\\n# Draw line graph\\nplt.figure(figsize=(10, 6))\\nplt.plot(df['Sum'], label='Sum')\\nplt.plot(df['Average'], label='Average')\\nplt.title('Line Graph of Sum and Average')\\nplt.xlabel('Index')\\nplt.ylabel('Value')\\nplt.legend()\\nplt.savefig('line_graph.png')\\n\\n# Export data to Excel\\ntry:\\n df.to_excel('data.xlsx', index=False)\\nexcept PermissionError:\\n print(\\\"Permission denied: 'data.xlsx'. Please close the file if it is open in another program.\\\")\\n\\n# Open Excel file\\ntry:\\n os.startfile('data.xlsx')\\nexcept PermissionError:\\n print(\\\"Permission denied: 'data.xlsx'. Please close the file if it is open in another program.\\\")\\n\"}"}}, "0x24a8bfa4dc0": {"type_": "nodes.basic.BasicNodeA", "icon": "c:\\Users\\Public\\cheatlayer\\examples\\Move.png", "name": "Bash Commands 5", "color": [13, 18, 23, 255], "border_color": [74, 84, 85, 255], "text_color": [255, 255, 255, 180], "disabled": false, "selected": false, "visible": true, "width": 160, "height": 71.2, "pos": [-130.0, 213.60000000000005], "port_deletion_allowed": false, "subgraph_session": {}, "custom": {"code": " \npip3 install pandas numpy matplotlib openpyxl\n\n\n", "Data": "{\"type\": \"bash\", \"code\": \" \\npip3 install pandas numpy matplotlib openpyxl\\n\\n\\n\"}"}}, "0x24a8bfa5a80": {"type_": "nodes.basic.BasicNodeA", "icon": "c:\\Users\\Public\\cheatlayer\\examples\\Move.png", "name": "Python Code 6", "color": [13, 18, 23, 255], "border_color": [74, 84, 85, 255], "text_color": [255, 255, 255, 180], "disabled": false, "selected": false, "visible": true, "width": 160, "height": 71.2, "pos": [130.0, 213.60000000000005], "port_deletion_allowed": false, "subgraph_session": {}, "custom": {"code": " \nimport pandas as pd\nimport numpy as np\nimport matplotlib.pyplot as plt\nfrom openpyxl import Workbook\nimport os\n\n# Generate random data\ndata = np.random.rand(100, 5)\ndf = pd.DataFrame(data, columns=['A', 'B', 'C', 'D', 'E'])\n\n# Calculate sum and average in new columns\ndf['Sum'] = df.sum(axis=1)\ndf['Average'] = df.mean(axis=1)\n\n# Draw line graph\nplt.figure(figsize=(10, 6))\nplt.plot(df['Sum'], label='Sum')\nplt.plot(df['Average'], label='Average')\nplt.title('Line Graph of Sum and Average')\nplt.xlabel('Index')\nplt.ylabel('Value')\nplt.legend()\nplt.savefig('line_graph.png')\n\n# Export data to Excel\ndf.to_excel('data.xlsx', index=False)\n\n# Open Excel file\nos.startfile('data.xlsx')\n", "Data": "{\"type\": \"python\", \"code\": \" \\nimport pandas as pd\\nimport numpy as np\\nimport matplotlib.pyplot as plt\\nfrom openpyxl import Workbook\\nimport os\\n\\n# Generate random data\\ndata = np.random.rand(100, 5)\\ndf = pd.DataFrame(data, columns=['A', 'B', 'C', 'D', 'E'])\\n\\n# Calculate sum and average in new columns\\ndf['Sum'] = df.sum(axis=1)\\ndf['Average'] = df.mean(axis=1)\\n\\n# Draw line graph\\nplt.figure(figsize=(10, 6))\\nplt.plot(df['Sum'], label='Sum')\\nplt.plot(df['Average'], label='Average')\\nplt.title('Line Graph of Sum and Average')\\nplt.xlabel('Index')\\nplt.ylabel('Value')\\nplt.legend()\\nplt.savefig('line_graph.png')\\n\\n# Export data to Excel\\ndf.to_excel('data.xlsx', index=False)\\n\\n# Open Excel file\\nos.startfile('data.xlsx')\\n\"}"}}, "0x24a9983eef0": {"type_": "nodes.basic.BasicNodeA", "icon": null, "name": "Python Code 7", "color": [13, 18, 23, 255], "border_color": [74, 84, 85, 255], "text_color": [255, 255, 255, 180], "disabled": false, "selected": true, "visible": true, "width": 160, "height": 71.2, "pos": [-130.0, 356.0], "port_deletion_allowed": false, "subgraph_session": {}, "custom": {"code": " \nimport os\nimport stat\n\nfile_path = 'data.xlsx'\n\n# Change the permission of the file\nos.chmod(file_path, stat.S_IRWXU | stat.S_IRWXG | stat.S_IRWXO)\n", "Data": "{\"type\": \"python\", \"code\": \" \\nimport os\\nimport stat\\n\\nfile_path = 'data.xlsx'\\n\\n# Change the permission of the file\\nos.chmod(file_path, stat.S_IRWXU | stat.S_IRWXG | stat.S_IRWXO)\\n\"}"}}}, "connections": [{"out": ["0x24a8bf7ef20", "out A"], "in": ["0x24a8bf7ff70", "in A"]}, {"out": ["0x24a8bf7ff70", "out A"], "in": ["0x24a8bfa42e0", "in A"]}, {"out": ["0x24a8bfa42e0", "out A"], "in": ["0x24a8bfa4640", "in A"]}, {"out": ["0x24a8bfa4640", "out A"], "in": ["0x24a8bfa4a60", "in A"]}, {"out": ["0x24a8bfa4a60", "out A"], "in": ["0x24a8bfa4dc0", "in A"]}, {"out": ["0x24a8bfa4dc0", "out A"], "in": ["0x24a8bfa5a80", "in A"]}, {"out": ["0x24a8bfa5a80", "out A"], "in": ["0x24a9983eef0", "in A"]}]}
Download AgentStep 1: Use Cheat Layer on websites to discover new Cheat Codes by asking it to automate what you want.
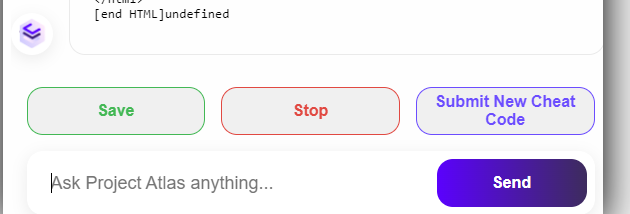
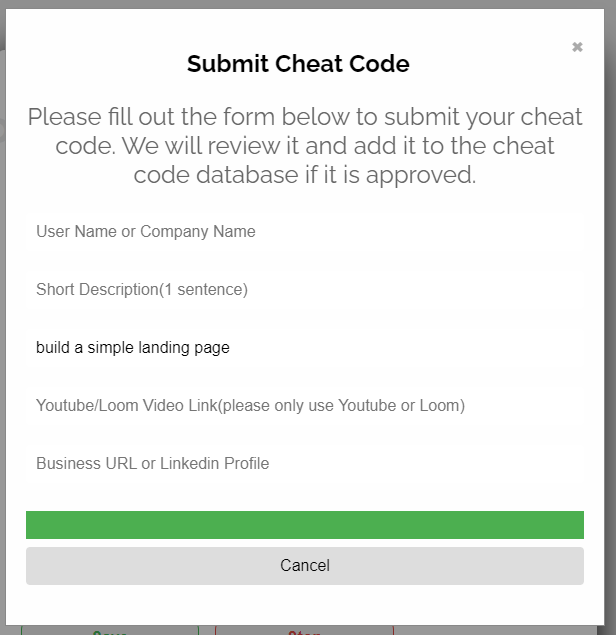